Guide
How Much Should I Have Saved for Retirement by Age?
On this page▾
Most Americans are behind on retirement savings — and most don’t know exactly how far behind they are. The problem isn’t lack of intention. It’s lack of a clear benchmark. How much should you have saved at 30? At 45? At 55? Financial advisors use several rules of thumb, the most widely cited being: have 1× your salary saved by 30, 3× by 40, 6× by 50, 8× by 60, and 10× by retirement. These numbers come from Fidelity’s widely-used retirement benchmarks and are a reasonable starting point — but they’re not the full picture. This guide gives you the benchmarks, the math behind them, and — more importantly — exactly what to do if you’re behind.
Try It: See If You’re on Track
Enter your current savings, age, income, and expected retirement age to see whether you’re ahead, on track, or behind — and by how much. The default scenario below is a 35-year-old earning $70,000 with $45,000 already saved — roughly the median American in that age group, per Federal Reserve data. Replace the numbers with your own to get personalised results:
Have your number? Here’s the full context for what it means.
The Standard Retirement Savings Benchmarks by Age
These benchmarks assume you want to maintain roughly your current lifestyle in retirement and plan to retire at 65. They’re expressed as multiples of your current annual salary:
| Age | Savings Target | Example ($70,000 salary) |
|---|---|---|
| 25 | 0.5× salary | $35,000 |
| 30 | 1× salary | $70,000 |
| 35 | 2× salary | $140,000 |
| 40 | 3× salary | $210,000 |
| 45 | 4× salary | $280,000 |
| 50 | 6× salary | $420,000 |
| 55 | 7× salary | $490,000 |
| 60 | 8× salary | $560,000 |
| 65 | 10× salary | $700,000 |
These benchmarks assume:
- You save 15% of your income annually (including any employer match)
- Your investments earn an average 5.5% real return (after inflation) over time
- You’ll spend roughly 55–80% of your pre-retirement income each year in retirement
- Social Security replaces approximately 40% of pre-retirement income for average earners
If any of those assumptions don’t apply to your situation — you started saving late, earn much more or less than average, plan to retire early, or expect a very different lifestyle in retirement — the benchmarks need adjustment.
What the Average American Actually Has Saved
The benchmarks above are targets. Reality looks quite different.
Federal Reserve Survey of Consumer Finances — Median Retirement Savings by Age:
| Age Group | Median Savings | Mean Savings | Fidelity Target |
|---|---|---|---|
| Under 35 | $18,880 | $49,130 | ~$45,000* |
| 35–44 | $45,000 | $131,950 | ~$140,000* |
| 45–54 | $115,000 | $254,720 | ~$280,000* |
| 55–64 | $185,000 | $537,560 | ~$490,000* |
| 65–74 | $200,000 | $609,230 | ~$700,000* |
Target based on median US household income of ~$70,000
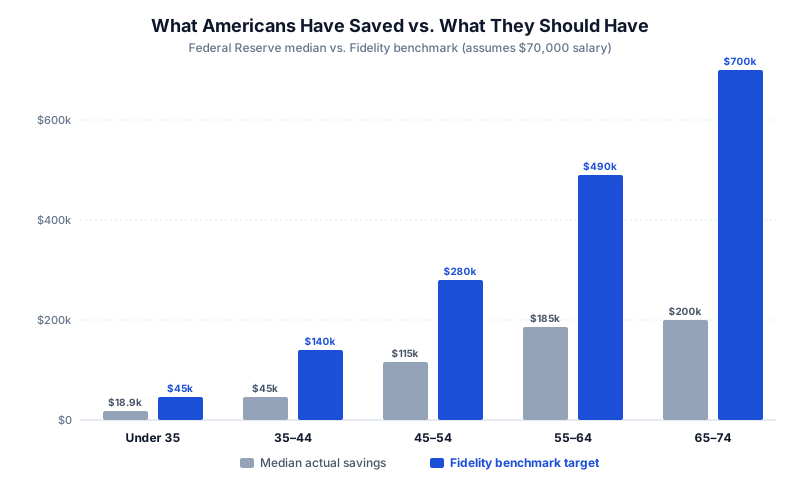
Sources: Federal Reserve 2022 Survey of Consumer Finances (median actual); Fidelity retirement benchmark guidelines (target, based on ~$70,000 salary).
The gap between median and mean savings is stark — a relatively small number of high savers pulls the average (mean) far above what most people actually have. The median figure is the more honest representation of where typical Americans stand.
The conclusion from this data: most Americans are significantly behind the benchmark at every age group. If your savings are at or above the median for your age, you’re doing better than most — but the median isn’t the target. The target is the Fidelity benchmark, and that gap is large for most people in their 40s and 50s.
💡 Important context: The mean savings figures are heavily skewed by wealthy households. If you’re comparing yourself to the “average American,” use the median figures — they represent what the typical person in your age group actually has, not what a small number of very wealthy households pull the average up to.
The Math Behind the Benchmarks
Where do these multipliers come from? The benchmarks are built on three linked calculations:
1. How Much You Need at Retirement
The starting point is the 4% rule — a widely-used retirement planning guideline that says you can safely withdraw 4% of your retirement portfolio per year without running out of money over a 30-year retirement.
Working backwards: if you need $50,000/year in retirement income from your portfolio, you need:
$50,000 ÷ 0.04 = $1,250,000 saved
If Social Security covers $20,000/year of your needs, you only need $30,000/year from your portfolio:
$30,000 ÷ 0.04 = $750,000 saved
This is why your expected Social Security benefit significantly affects your savings target — every $1,000/month in Social Security income reduces the portfolio you need by $300,000.
2. The Role of Compound Growth
The benchmarks assume your savings are invested and growing. A dollar saved at 25 has 40 years to compound before retirement at 65. A dollar saved at 45 has only 20 years. This is why the benchmarks accelerate so sharply in your 50s — the compounding advantage shrinks every year you delay.
At a 7% annual return:
- $10,000 saved at 25 → $149,745 by age 65
- $10,000 saved at 35 → $76,123 by age 65
- $10,000 saved at 45 → $38,697 by age 65
- $10,000 saved at 55 → $19,672 by age 65
The same $10,000 saved at 25 is worth nearly 8× more at retirement than the same $10,000 saved at 55. This is the most compelling argument for starting early — not discipline or virtue, but pure mathematics.
3. The 15% Savings Rate
The benchmarks assume you’re saving 15% of your gross income consistently from your mid-20s through retirement. This includes both your contributions and any employer match.
If your employer matches 4% of your salary and you contribute 11%, you hit 15% total. If you have no employer match, you need to contribute the full 15% yourself.
Most Americans save far less than 15%. The average 401(k) contribution rate is around 7–8%, and many people have no retirement savings at all. This is the primary reason the median savings figures are so far below the benchmarks — not that the targets are unrealistic, but that the consistent 15% savings assumption is one most people don’t meet.
Retirement Savings by Decade: What to Focus On
Your 20s: Start — That’s the Only Rule
The single most important thing you can do in your 20s is start saving anything. The specific amount matters far less than the habit and the compounding time you’re buying.
Primary goals in your 20s:
- Capture the full employer 401(k) match — this is a guaranteed 50–100% return on that money, every year
- Build a $1,000 emergency fund first — then start investing
- Contribute to a Roth IRA if eligible — tax-free growth over 40+ years is extraordinarily powerful
- Aim for 10–15% total savings rate — including employer match
Why Roth makes sense in your 20s: You’re likely in a lower tax bracket now than you will be at peak earning years. Paying tax now on Roth contributions — and never paying tax on the growth — is often the mathematically superior choice for young savers.
Reality check: If you’re 28 with $15,000 saved, you’re behind the $70,000 benchmark for a $70,000 salary — but you have enormous time to close the gap. Starting now matters far more than how far behind you currently are.
Your 30s: Build the Foundation
Your 30s are when income typically rises significantly — promotions, career changes, growing expertise. This is the decade to lock in saving habits before lifestyle inflation consumes the raises.
Primary goals in your 30s:
- Increase savings rate with every raise — aim to save at least 50% of each raise before lifestyle adjusts
- Max out 401(k) if possible ($23,500 in 2025)
- Build retirement savings toward the 2× salary target by 35 and 3× by 40
- Pay off high-interest debt aggressively — nothing destroys wealth-building like 20%+ credit card interest
The lifestyle inflation trap: A $15,000 raise at 32 feels like a massive windfall. Most of it disappears into a nicer apartment, a newer car, and more frequent restaurant meals — without a conscious decision. Automating an increased savings contribution before you see the raise is the single most effective countermeasure.
Common 30s mistake: Treating the house down payment as the only financial priority. A $70,000 down payment that delays retirement savings by 5 years may cost more in lost compound growth than it gains in home equity — especially at current rates.
Your 40s: Acceleration Phase
Your 40s are typically peak earning years — and peak spending years simultaneously. Kids in college, aging parents, lifestyle expectations that have grown for two decades. This is the decade where the gap between your savings rate and your income is either growing or shrinking.
Primary goals in your 40s:
- Target 4× salary saved by 45 and 6× by 50
- Maximize 401(k) contributions — you’re likely in your peak tax bracket, making pre-tax contributions especially valuable
- Avoid raiding retirement accounts for college, renovations, or other large expenses
- Run a serious retirement projection — at 45, you’re close enough to retirement that modeling your specific trajectory matters
The college funding vs retirement dilemma: Many parents in their 40s face pressure to fund children’s college at the expense of retirement savings. The honest financial answer: you can borrow for college; you cannot borrow for retirement. Your children have decades to repay student loans. You have 20 years to fund 30 years of retirement. Prioritize your retirement — a financially secure parent is a better outcome for the whole family than a fully-funded college account.
Your 50s: Catch-Up Territory
If you’re 50 and behind the benchmarks, this is when catch-up contributions become available — and essential.
2025 catch-up contribution limits (age 50+):
- 401(k)/403(b): Regular limit $23,500 + $7,500 catch-up = $31,000 total
- IRA (Traditional or Roth): Regular limit $7,000 + $1,000 catch-up = $8,000 total
- Total maximum tax-advantaged retirement savings: $39,000/year
If you can max all of these at 50 and earn a 7% return, you can accumulate approximately $540,000 in additional savings by 65 — purely from the next 15 years. It’s not too late.
Primary goals in your 50s:
- Maximize all catch-up contributions
- Eliminate mortgage and other debts before retirement if possible
- Get serious about Social Security claiming strategy — the difference between claiming at 62 vs 70 can be $100,000+ in lifetime benefits
- Model multiple retirement scenarios — what if you retire at 62? At 65? At 67? How do the numbers change?
Your 60s: Final Approach
The decade before retirement is about optimization, not accumulation. Your key decisions now lock in your retirement income for the next 30 years.
Primary goals in your 60s:
- Shift asset allocation gradually toward more conservative investments
- Decide on Social Security claiming age — waiting from 62 to 70 increases your monthly benefit by approximately 76%
- Understand Required Minimum Distributions (RMDs) — starting at age 73 for most accounts
- Consider Roth conversions — converting traditional 401(k)/IRA funds to Roth before Social Security and RMDs start can reduce lifetime tax burden significantly
- Plan your withdrawal sequence — which accounts to draw from in which order matters enormously for tax efficiency
What If You’re Behind? A Realistic Action Plan
Being behind on retirement savings is the norm, not the exception. Here’s a realistic path forward regardless of your age:
Step 1: Know Your Exact Number
The benchmarks are a useful screen but your actual target depends on your specific expected retirement age, spending needs, Social Security benefit, and any other income sources (pension, rental property, part-time work). Run your specific numbers.
Step 2: Capture Every Dollar of Employer Match
If your employer offers a 401(k) match and you’re not contributing enough to capture it fully, you’re leaving guaranteed free money on the table. A 4% match on a $70,000 salary is $2,800/year — every year you don’t capture it, it’s gone forever. This is step zero before any other savings decision.
Step 3: Increase Your Savings Rate by 1% Per Year
If jumping from 5% to 15% feels impossible, don’t. Increase by 1% of your salary each year — ideally timed to coincide with a raise so you never feel the reduction in take-home pay. Over 10 years, you go from 5% to 15% without a single painful adjustment.
Step 4: Eliminate High-Interest Debt First
There is no investment that reliably returns 20–24%. If you have credit card debt at those rates, paying it off is mathematically equivalent to a guaranteed 20–24% return. Eliminate it before investing beyond the employer match.
Step 5: Maximize Tax-Advantaged Accounts in Order
The optimal order for retirement saving (for most people):
- 401(k) up to full employer match (free money)
- Roth IRA up to annual limit ($7,000 or $8,000 if 50+)
- 401(k) up to annual limit ($23,500 or $31,000 if 50+)
- Taxable brokerage account (no limit, no tax advantages)
Step 6: Don’t Touch It
The single most destructive thing you can do to retirement savings is withdraw or borrow against them early. A 401(k) early withdrawal (before 59½) triggers income tax plus a 10% penalty — on a $20,000 withdrawal in the 22% bracket, that’s $6,400 gone immediately, plus the lost compounding on the $20,000 for the remaining decades.
The Impact of Retiring Earlier or Later
The benchmarks above assume retirement at 65. Every year earlier you retire adds to the required savings; every year later reduces it — dramatically.
How retirement age affects required savings (assuming $70,000 salary, 4% rule):
| Retirement Age | Years in Retirement | Approx. Portfolio Needed* |
|---|---|---|
| 55 | ~35 years | $1,400,000+ |
| 60 | ~30 years | $1,200,000 |
| 65 | ~25 years | $1,000,000 |
| 67 | ~23 years | $900,000 |
| 70 | ~20 years | $800,000 |
Assumes $40,000/year needed from portfolio (after Social Security), slightly higher portfolio needed for longer retirements to account for sequence-of-returns risk
Retiring at 55 vs 65 requires roughly 40% more savings — both because you need the money for more years and because you have 10 fewer years to accumulate it. Early retirement is achievable but requires a significantly higher savings rate throughout your working years.
Social Security: The Variable Most People Underestimate
Social Security is a meaningful part of most people’s retirement income — and most people know surprisingly little about how it works.
The average Social Security benefit is approximately $1,800–$1,900/month ($21,600–$22,800/year) for someone retiring at full retirement age (67 for people born in 1960 or later). High earners receive more; lower earners receive less.
Claiming at 62 (the earliest option) reduces your benefit by approximately 30% permanently. Waiting until 70 increases it by approximately 24% above the full retirement age benefit. The difference between claiming at 62 vs 70 can be $700–$1,000+/month for the rest of your life.
Every $1,000/month in Social Security income reduces the portfolio you need to save by $300,000 (at the 4% withdrawal rate). This means the decision of when to claim Social Security is one of the highest-impact financial decisions you’ll make in your 60s.
The Bottom Line on Retirement Savings
The benchmarks exist to give you a target — not to induce anxiety. The majority of Americans are behind them, at every age. What matters more than where you are today is the direction you’re heading and the rate at which you’re moving.
The three decisions that have the largest impact on retirement outcomes:
- When you start — every decade of delay approximately halves the final outcome
- How much you save — the savings rate matters more than investment returns for most people
- When you claim Social Security — an 8-year difference in claiming age can mean $200,000+ in lifetime benefits
Everything else — which funds you choose, whether to use a Roth or traditional account, exactly which benchmarks to follow — matters less than getting these three decisions right.
Once you have your number, here are the logical next steps:
- → 401(k) Calculator — Model exactly how your 401(k) grows at different contribution rates
- → Roth IRA Calculator — See the long-term power of tax-free Roth growth
- → Social Security Calculator — Find your estimated benefit and model early vs late claiming
- → Compound Interest Calculator — See exactly what starting earlier or saving more does to your final number
- → Investment Calculator — Model different return scenarios for your retirement portfolio
- → Debt Payoff Calculator — If debt is slowing your savings, calculate how fast you can eliminate it
Retirement savings benchmarks are based on Fidelity Investment guidelines. Federal Reserve savings data from the 2022 Survey of Consumer Finances. 401(k) and IRA contribution limits reflect 2025 IRS figures. Social Security benefit estimates are illustrative. This article is for general educational purposes — consult a financial advisor for personalized retirement planning guidance.
Frequently Asked Questions
How much do I need to retire comfortably? ▾
The standard answer is 10–12× your final salary, which aligns with the 4% rule applied to roughly 70–80% income replacement. On a $70,000 salary, that's $700,000–$840,000. Your specific number depends on your expected retirement age, lifestyle, Social Security benefit, healthcare costs, whether you have a mortgage or rent in retirement, and any other income sources. Many people find they need less than the rule of thumb suggests (simpler lifestyle, paid-off home) while others need more (early retirement, high healthcare costs, expensive location).
Is it too late to start saving for retirement at 40? At 50? ▾
No — it's never too late, though the required savings rate increases significantly the later you start. At 40 with nothing saved, targeting retirement at 65, you'd need to save approximately 25–30% of your income to hit the benchmarks. At 50, it's closer to 35–40%. These are high rates but achievable with discipline and maximizing catch-up contributions. The key insight: starting now and saving aggressively for 15–25 years is dramatically better than never starting because the goal seems out of reach.
Should I pay off my mortgage or save for retirement? ▾
Generally, prioritize retirement savings over extra mortgage payments — especially if you're behind on retirement benchmarks. A mortgage at 6.5% is expensive, but the guaranteed employer match and tax benefits of retirement accounts almost always outweigh extra mortgage paydown. The exception: if you're within 5 years of retirement and your mortgage rate is high, paying it off may make sense for the cash flow certainty it provides in retirement.
How does inflation affect my retirement savings goal? ▾
Inflation erodes purchasing power over time — $1,000,000 in 25 years will buy significantly less than $1,000,000 today. The benchmarks already account for this by assuming a real (inflation-adjusted) return of roughly 5–5.5% rather than nominal returns. When running calculations, use real returns rather than nominal returns to automatically account for inflation, or add an explicit inflation assumption to your model.
What is the 4% rule and is it still reliable? ▾
The 4% rule comes from the Trinity Study and states that a portfolio of 50–75% stocks and 25–50% bonds has historically supported a 4% annual withdrawal rate (adjusted for inflation) over any 30-year period without running out of money. More recent research suggests 3.3–3.5% may be more conservative given lower expected bond returns and longer life expectancies. For a 30-year retirement, 4% is a reasonable starting estimate; for a 40+ year retirement (early retirees), consider using 3.5% to be safer.
How much does an employer 401(k) match affect my retirement? ▾
Enormously. A 4% employer match on a $70,000 salary is $2,800/year. Compounded at 7% over 30 years, that $2,800/year becomes approximately $283,000 in additional retirement savings — just from the match, before your own contributions. Not capturing the full match is the most expensive financial mistake most people make, equivalent to turning down a pay raise every year.